

The numbers come from the brands. Not from us.
Every result below states what was measured, over what period, and against what baseline. Where a brand asked to stay anonymous, the numbers are still theirs — only the name is missing.
No projections. Nothing here is modelled — it either happened or it isn't on this page.
 Collagen rebuild — hero image
 Nordic Lifting — listing set
 Packaged meals — image stack
 Sports nutrition — A+ module
 Ops Tool — measurement baseline
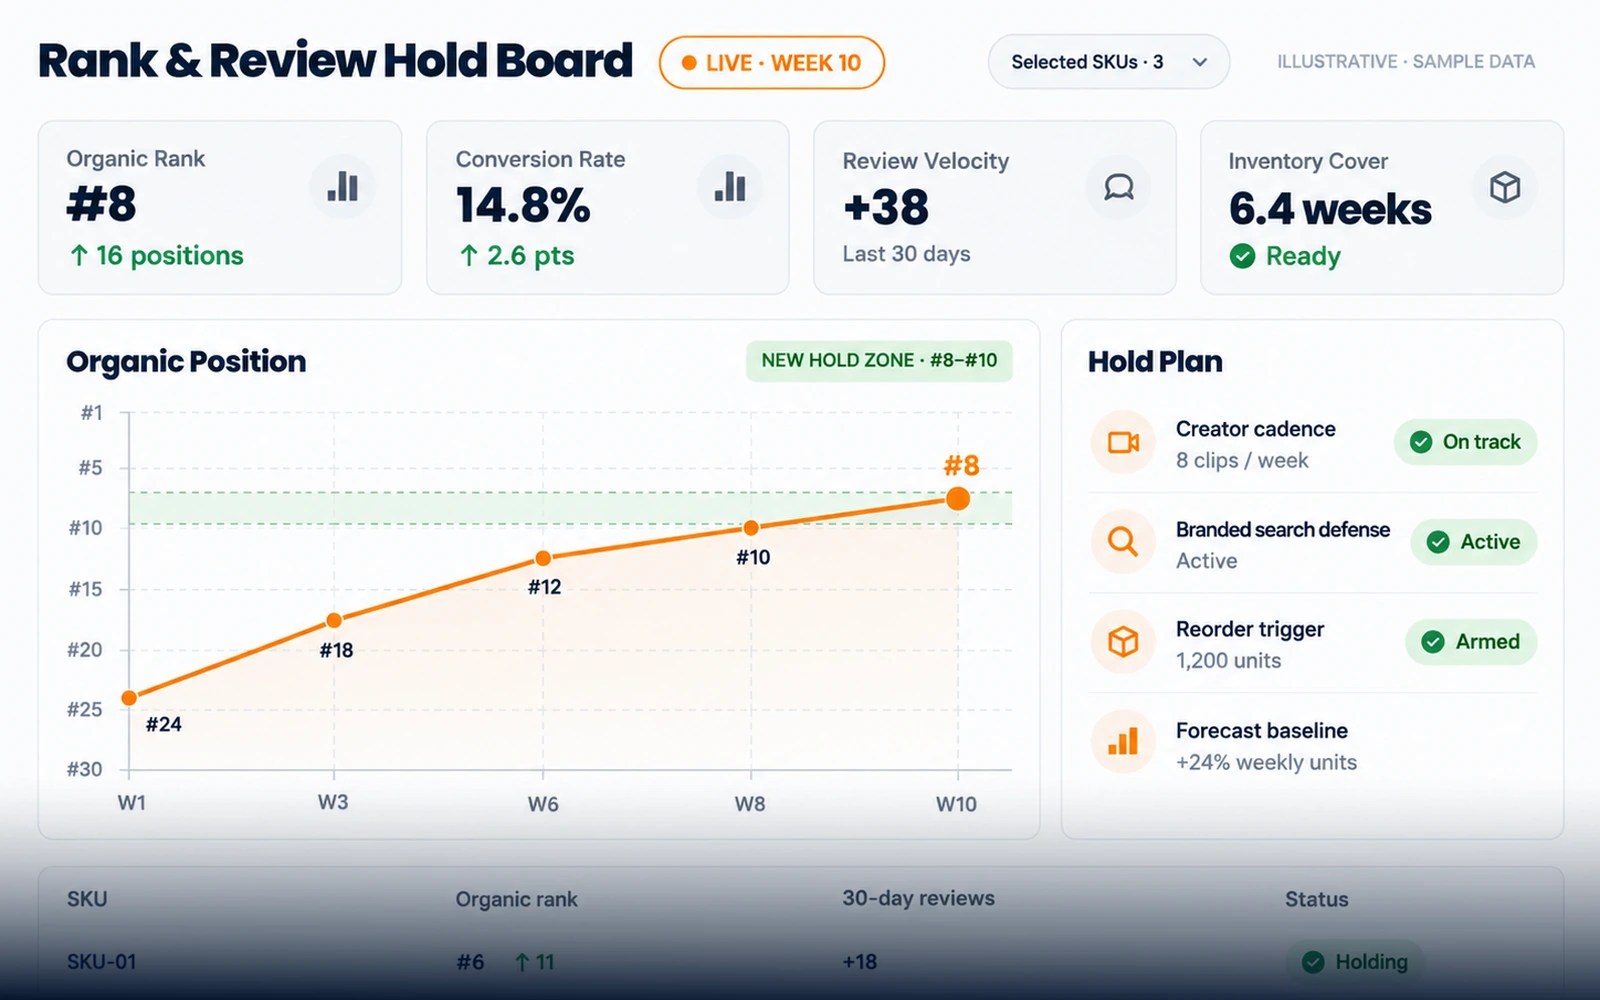 Weekly scorecard — client view
What changed, and what it was worth.
Filter by channel.
 Creative · Amazon
conversion rate, and $42K added per month
Collagen brand lifts conversion 38% without touching ad spend
A premium collagen brand was carrying high acquisition costs and low conversion. We rebuilt the creative and marketplace strategy rather than buying more traffic — the media budget stayed where it was.
Read the case study → Amazon
How Nordic Lifting revived Amazon ad performance through AI
An established fitness equipment brand had plateaued despite strong brand history. We rebuilt the advertising structure around AI-assisted monitoring and senior review.
Read the case study → Creative
Packaged meals brand nearly doubles click-through on a rebuilt listing
"We saw an immediate jump in CTR. Customers finally get the value of our premium product through these images." Measured on the rebuilt listing against its own prior baseline.
See the creative work → Creative
Sports nutrition brand lifts conversion on a full image rebuild
Same product, same price, same traffic. The only variable that changed was the creative — hero image, image stack and A+ Content rebuilt together.
See the creative work →TikTok Shop and staffing case studies are being written
We publish results once the brand has agreed the numbers and the period they cover. If you want to see something specific before it's public, ask on a call and we'll walk you through it.
Ask for the detail →No case studies published for that channel yet. Ask us for the detail on a call — we can walk you through work that isn't public.
Most agency case studies are unfalsifiable. These aren't.
A percentage with no baseline, no period and no mention of what else changed is marketing, not evidence. Here are the rules we hold ourselves to on this page.
Get an audit of your own account →- Baseline stated. Every figure is measured against the same account's prior period, not against a category average or a competitor.
- Period stated. A lift over 30 days and a lift over 12 months are different claims, so we say which.
- Other variables named. Where ad spend, price or seasonality also moved, we say so. Where they didn't, we say that too — it's usually the more interesting fact.
- No projections. Nothing on this page is modelled or annualised from a short window.
- Client-approved. Numbers are published only once the brand has confirmed them. Some brands prefer to stay anonymous, so the name is withheld rather than the result inflated.
- Losses exist. Not every rebuild wins. Split-test history in your dashboard shows the tests that lost as well as the ones that worked.
Results start with the same 72 hours.
Every engagement on this page began with an audit. It's free, it takes three days, and you keep it whether or not you hire us.
Audit
The most important bottlenecks, risks and opportunities across listings, advertising, content and inventory — with the three moves we'd make first.
Roadmap
Findings become a prioritised plan with owners, dependencies and the outcomes we expect from each move.
Live
Operator named, pod assembled, reporting open. Everything after this point is measured against the baseline we captured in the audit.
Drag it. Same product, same price, same traffic.
The packaged-meals listing that nearly doubled click-through. The only variable that changed was the creative — hero image, image stack and A+ Content rebuilt together, measured against the listing's own prior baseline.


Because they asked to be. Many brands treat marketplace performance as competitive information and would rather their category rivals not know who runs their channel. We would rather publish a real number without a name than a named story with a softened number.
No, and no agency's published case studies are. These are selected examples where the work produced a clear, measurable change. What they demonstrate is what the approach can do on a catalog where there was real headroom — the audit tells you whether yours has that headroom before you commit.
Yes, at the right stage. We ask permission before connecting anyone, so references are arranged during a live conversation rather than listed on the site.
Because each one needs client approval on the numbers and the period they cover, which takes longer than writing them. More are in progress. If you want to see work in a specific category before it's published, ask on a call.
It depends on what's broken. Operational fixes — suppressions, stranded inventory, wasted search terms — show up in weeks. Creative rebuilds need a test cycle to prove out. Ranking and catalog work compounds over months. The roadmap you get on day five sequences them so the fast wins fund the patience.
See what the gap looks like on your account.
Free 72-hour audit. The three highest-leverage moves on your catalog, with the baseline we'd measure against. Yours whether or not you hire us.
Get my free audit →